Whether your goal is to boost sales for your online business or simply attract more visitors to your site, Google Analytics represents a powerful tool to analyse your site’s performance. That’s why we offer Google Analytics assistance with every website we design.
So how does Google Analytics work? In simplest terms, it provides many kinds of data which together form a comprehensive picture of your current online audience. Naturally this picture may fall short of your expectations, but once you understand why your site is not performing up to par, you can set about tailoring your website to better fit your customers’ needs and wants. All statistics are dynamic and some are even delivered in real-time.
For instance, Google Analytics has tools to track the routes people take to reach you, including the devices they use and the keywords they search for. With In-Page Analytics, you can also analyse how visitors are interacting with your site and determine which pages hold their attention the longest. For online businesses, marketing reports are one of the most valuable assets Google Analytics provides. Using sophisticated measurement tools, you can evaluate the success of marketing campaigns, particularly with regard to the effectiveness of ads and site content. You’ll finally be able to see what action on your part actually led to a purchase and, with real-time reporting, you can watch your audience’s response to your latest message. At the same time, you can remove obstacles to those conversions by monitoring for slow page loads, poorly placed content and site crashes.
Empowered with these insights, you can dive into marketing tests, comparing the results to figure out what works and what doesn’t. This will enable you to capitalise on every opportunity. You’ll also be able to create reports and share them with employers and colleagues so that you can develop a unified strategy.
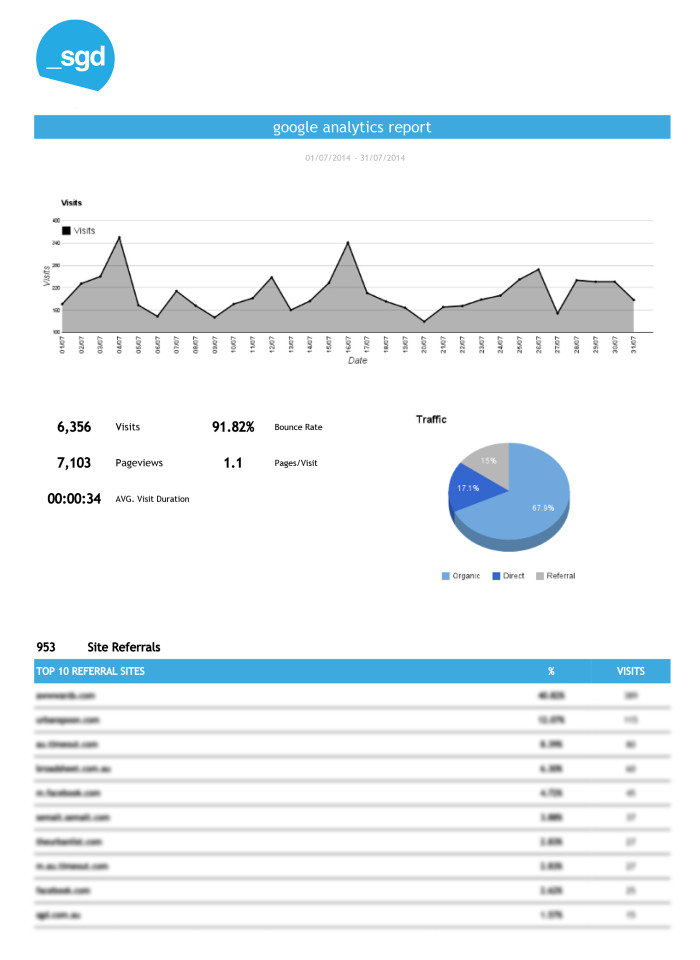
Now, we understand that the Google Analytics reports can be overwhelming or difficult to read, at least at first, so to help you digest the information we offer a monthly PDF report. We break down the high levels of data into easy-to-use graphs and simple-to-read tables that show you the most common referrals, important keywords and hits per day, where your visitors are coming from, how long they are spending on your site, as well as whether they are using a computer or mobile device to access your site.

Stats will include:
- Overall page views and a comparison to the two weeks prior.
- A comparison of your site’s new visitors vs. returning visitors.
- How many pages a user is seeing per visit and the time spent on your site.
- Traffic originating from Facebook and Twitter.
- How much traffic came from organic search results.
- Overall page views from your social media efforts.
- Any changes in your site’s bounce rate.
If you would like to see a full sample report, please click here and we’ll email it out to you.
Author

James Fulton
Since founding the company in 2012, James has been the driving force behind SGD's success. As a visionary leader, he guides the SGD team, encouraging them to continually excel in digital design. James inspires a culture of growth, challenging each team member to surpass their own limits and set new standards in the field. This commitment to excellence not only propels personal development but also ensures SGD consistently delivers exceptional results for its clients.
Next Article
Do I Really Need SSL?
August 22, 2014Get Started


